Best Prices And Deals
- 97%
Best value

Orderflows Trader 7.0 for NT8

Add to wishlistAdded to wishlistRemoved from wishlist 16

Orderflows Trader 7.0 for NT8-Is The Most Robust Order Flow Trading Software On The Market Designed By A Trader For Traders.The Best NT8 Indicators

Original price was: 749,00 $.Current price is: 24,95 $.

15 Item Sold

Full Product Description:

Producer:www.orderflows.com/oft5.html

Content: Full Software

Original Price: $749


ORIGINAL VERSION,THIS IS AN ORIGINAL VERSION

ORIGINAL VERSION,THIS IS AN ORIGINAL VERSION

PREMIUM VERSION NT8

Anything you need, any help with installation, if you have a problem or doubt about your download link, contact us at:

forexoutletshop@gmail.com

Please enter a “CORRECT AND CORRECT EMAIL ADDRESS” when filling out your order, so that the system will send you the download link.

Also check your “SPAM” email, or contact us at:

forexoutletshop@gmail.com


System information:

Orderflows Trader 7.0 For NinjaTrader 8
The Future Of Order Flow Trading Is Here…And Orderflows Brings It To You First!
Take a look a video below:
https://player.vimeo.com/video/918409344?autoplay=0&loop=0
When It’s About Your Trading – Don’t Rely On Guesswork Or Your Intuition…
Orderflows Trader 7.0 Is The Most Robust Order Flow Trading Software On The Market Designed By A Trader For Traders.
New Order Flow Tools
Orderflows Trader 7.0 is a major upgrade in terms of functionality as well as analytics. There are 13 new order flow analysis tools & improvements to help you understand the order flow: Accumulation/Distribution, Open POC, Aligned POCs, Orderflows Gaps, Imbalance Reload, Volume Decline, POC Wave, Delta Tail, Resting Liquidity, Vertical Liquidity, Delta Breakout, Retail Suck, Price Action Divergence. These tools are hard-coded into the Orderflows Trader 7.0, there is no additional cost or software to add on.
Standard Order Flow Tools
In addition to the new order flow analysis tools listed above, you will also get our existing standard order flow analysis tools that came with the earlier versions of Orderflows Trader: Market Sweep Detector, Market Weakness Detector, Orderflows Sequencing, POC Slingshot, Value Area, Value Area – EVA, and Inverse Imbalance, Orderflows Delta Divergence, Exhaustion Print, Imbalance Reversal, Zero Prints, Volume Profile, Stacked Imbalance, Multiple Imbalance, Unfinished Business, Prominent Point of Control, Orderflows Ratio. Other software companies have copied our tools and pawned them off as their own, but don’t show you how to use them because they just don’t understand how to use them. What is the point? If you have tools to analyze the order flow, you also need to learn how to apply them. I show you how to use all these tools in your everyday trading.

Orderflows software which runs on the Ninjatrader platform and combines charting and order flow in a dynamic, real-time way that allows the trader to view the market’s evolving and changing state. Its primary benefit rests in its unique ability to see a clearly who is in control of the market based on market generated information as it happens. If you have ever sat and watched the market trade for an extended period of time you start to see how orders are filled in the market and their impact on market direction. There are aggressive traders and there are passive traders. When you know how to tell the difference between the two types, then you can understand where the direction of the market.

Focusing on order flow changes everything! It is a better way of trading than the popular systems of indicators and messy indecipherable charts. Nothing could be simpler. No need for all those cluttered charts. Stop using charts cluttered with indicators. They are not helping you. They are cluttering up your decision-making process. They don’t even give you current market conditions.

Order flow  is not a trading system by itself.  Rather the order flow is the analysis of orders being traded as they flow into the market. The Orderflows Trader is software that allows the trader to see what is happening in the market in real-time giving an x-ray view into the market so the trader can see what exactly is happening as it happens. Once a trader understands what is happening in the present, the trader is able to make better decisions about what might happen in the future. 

If the market did the same thing every day, trading would be simple. Think about it, a moving average trading system will generate nice profits in a trending market. But what happens in a sideways market? Traders often give back all their profits and then some because they don’t understand that conditions in the market have changed. They just continue doing the same thing that made them money in the past.

Not being able to notice a change in market conditions is what destroys many traders. They think they have come up with a “Holy Grail” trading system that turns the market into their own personal ATM cash machine. But most Holy Grail systems are destined to self-destruct because it is not flexible to market conditions.

If an inflexible Holy Grail system will blow up so will an inflexible trader.

A trader must react and automatically adjust and compensate for changes in market conditions. Flexibility is key. Order flow tells you the market’s underlying currents. You know that there are days when the market wants to run in one direction and days when the market just wants to rotate back and forth.

In a rotational market, traders sell every rally and buy every dip. This works well until the market starts trending. But a bell doesn’t go off and the market doesn’t announce “I am going to start trending now.” It just does it. Traders selling every rally get caught offside and contribute to the rally even more while covering their losses. Then what happens? Market conditions change again and the market starts rotating again. And again, no bells or whistles or announcements to announce this change in market condition. But order flow traders don’t need announcements as they are in sync with what the market is doing and how it is doing it.

Think of it! No Calculus. No Lagging Indicators. No Moving Anythings! Orderflows Trader 7.0 offers you a logical, straightforward approach to analyzing the markets that could dramatically improve your trading!

A properly constructed chart consists of volume and price factors, that when combined produce easily identifiable order flow patterns that will help you trade with reasonable accuracy. Additionally, a successful trading plan and money management are better applied when a trader is working with a better-designed chart.

With the Orderflows Trader 7.0 you will now be able to decode order flow sequences and how to read them like institutional traders do. You have real-time intelligence that is unlimited. You will now have invaluable order flow intel that impacts the market before price even starts moving. You will be ahead of you retail trading competition which gives you a tremendous edge in the market. You will be trading alongside the big institutional traders who are one, two and three steps ahead of the small retail traders.

Most traders are weak on analyzing the present and you have to trade in the present, you still have to get in and get out in real time. So it makes sense to analyze the present as good as you can to qualify better trade locations and most importantly, near-term support.

At first, an Orderflows Trader chart looks a little bit overwhelming, but it’s really very simple to use. You will soon realize that the Orderflows Trader chart is the most important chart you will ever use.

What Makes Orderflows Trader 7.0
Such A Game Changer For Traders?
Many of Orderflows Trader 7.0’s incredible features
are proprietary and “first-to-market”!
32 Plottable Order Flow Analysis Indicators.
Additionally, there are exclusive order flow delta analytics in Orderflows Trader to expose the underlying mechanics no one else sees.
Take A Look…
Your Charts Now Come To Life…
Orderflows Trader 7.0 for NT8 2

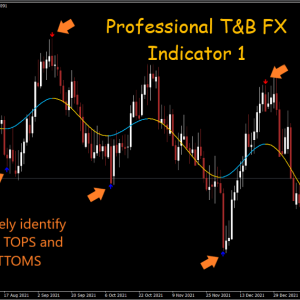
Orderflows Trader 7 is a colorful representation of what is taking place in the market.

Researchers at 3M Corporation found that the brain processes visuals 60,000 times faster than text. Further studies find that the human brain deciphers image elements simultaneously, while language is decoded in a linear, sequential manner taking more time to process. So it makes sense to make the chart as visual as possible to make analysis as quick as possible.

The Orderflows Trader allows you to organize data in a way that reveals consistent and predictable market behavior…!

The key elements of Orderflows Trader software are traded price, traded bid volume, traded ask volume over a range, volume or time period. When these elements are displayed in a chart, traders will be able to identify the market’s areas of strength and weakness. Every market moves up or down based on the interaction between supply and demand. Traditional charting techniques or analysis do not accurately allow you to analyze, understand and interpret the fighting forces of supply and demand. Orderflows allow you to dissect the supply and demand balance in real time as it is happening. You will understand which side is in control and be prepared to respond when it changes.

Order flow trading is a universal method of analysis that can be combined with just about any technical study. Technical indicators are based on complicated calculations to manipulate past price activity tend to mask the reality of what is happening in the market. Order flow goes right to the roots of what is happening now and lets you exploit that information for your benefit.

There are basically two types of traders in the market: the big guys and the small guys. You can replace those terms with names such as “Smart Money” and “Dumb Money” or “Institutional Traders” and “Retail Traders.” You often hear people say “follow the smart money.” Well, it sounds simple, but how can you figure out what the smart money is doing by looking at a normal bar chart? You can’t. Order flow makes it very easy for you to determine which side is doing what at that moment by breaking down the volume that is actually being traded in the market.

The real power of Orderflows is that it identifies “hidden” trade locations that can’t be seen using traditional charting techniques. We built our own tools in order to process the order flow as it happens to help find the hidden trade opportunities within a bar. Nothing is more visual and reflects true market sentiment better than the Orderflows chart.

View Order Flow Through Different Views!
Within the Orderflows Trader 7.0 you have your choice of 4 different volume footprint charts:
Orderflows Trader 7.0 for NT8 3
1. Bid/Ask – This is the standard footprint chart that shows the volume traded on the bid and the volume traded on the offer. The most common form of order flow chart.
Orderflows Trader 7.0 for NT8 4
2. Delta – View the delta (difference between the volume traded on the bid versus the volume traded on the offer) horizontally. This view allows you to focus on the aggressive trading occurring in the market. The volume traded on the bid side versus the volume traded on the offer side at a price, NOT the two-way auction. This is delta at price.
Orderflows Trader 7.0 for NT8 5
3. Volume – A different way to view a chart. Shows the total volume at price at each level. The price level with the most volume in the bar is the POC.
Orderflows Trader 7.0 for NT8 6
4. Diagonal Delta – Plot the delta on your footprint chart based on the two-way auction, the bid versus the offer.
Orderflows Trader 7.0 for NT8 7
While the Bid/Ask chart is the most common order flow chart used. You have additional choices of viewing what market participants are doing in the market. Traders are finding edges through the order flow delta charts because they are able to pinpoint what the big aggressive institutional traders are doing in the market at any given moment.
Order Flow Gives You An Edge…

Without a doubt, order flow analysis gives you an edge over other traders. While other traders are looking at price bars or candlestick bars with just open, high, low and close, the order flow chart lets you look inside a bar to see when there is aggressive buying or selling taking place while the bar is forming. You can literally be making trading decisions while the bar is forming, thus putting you ahead of other traders who don’t yet realize what is happening in the market.

With order flow you can literally see market generated information that is impacting the market before price even starts to move. The markets trade in real time and most traders are very weak in analyzing the present market conditions. You have to trade in the present, you got to get in and get out in real time. So it just makes sense to analyze the present market conditions as best as you can to find better trade locations as well as near term support and resistance levels.

It Is Up To You To Take The Edge! 
Orderflows Trader 7.0 Is Coded With 13 NEW & Powerful Order Flow Analysis Tools!
1. Accumulation/Distribution
The Accumulation/Distribution tool analyzes the order flow in a bar to determine if there is Accumulation (Bullish) or Distribution (Bearish) order flow being traded in a bar. There is an extra filter called “Passive Traders In Control” that finds instances when strong bidders (bullish) or offers (bearish) are present in the Accumulation or Distribution that is taking place. Too often traders get lost in the numbers of the footprint chart. The Accumulation/Distribution tool takes the headache away and shows you when important order flow is trading.
2. Open POC
POC is the price level in the bar with the most volume. When volume start to lead price higher or lower that is a good sign of a strong move. When an Open POC occurs there is usually a move just beginning. If you know a move is just beginning to start you can get it with tighter stops and more upside potential. Healthy moves have healthy volume and when volume moves in the direction of the move, those are some of the best trades to take.
3. Aligned POCs
When Aligned POCs occur it is a sign of a market balancing. POC is the price level in the bar with the most volume and if consecutive bars are trading the same price level, that is a sign that traders are happy to transact at that level. The market has found a fair price. Ok, that’s wonderful. So what? Well, as a trader you need to anticipate what can happen next based on the information the market is giving you. If you know the market was balanced for a couple of bars, then you want to get ready for when the market goes out of balance, because that is when the moves happen.
4. Orderflows Gaps
Orderflows Gaps represent a divergence between price and value caused by shifting sentiment and speculative order flow. Spotting them early is key and now you can. Identifying when these Orderflows Gaps emerge allows traders to spot mispricing and speculation-driven moves. Analyzing the accompanying order flow allows you to determine whether the gap is justified and likely to revert back towards fair value.
5. Imbalance Reload
When traders look at imbalances, they often only look at imbalances in a bar. The Imbalance Reload looks at imbalances spread out over consecutive bars. When you see buying imbalances or selling imbalances coming in at the same level over consecutive bars it is a sign of strong directional aggressive trading. If there is strong aggressive trading taking place at a price level over consecutive bars you know there is a trader who is trying to trade size without moving the market.
6. Volume Decline
A Volume Decline is a sign of the market moving away from levels because of lack of interest at those higher or lower levels by traders. Bullish Volume Declines occur at bottoms of green-up candles or the top of red-down candles. It is a form of price rejection. Once you know a price level is being rejected then you can be more confident and accurate in the near term direction of the market.
7. POC Wave
POC Wave is a 3-bar POC setup that is great for identifying potential market turning points. What happens in a POC Wave is the market is a little tentative to move one way or the other, then it makes a fake breakout or breakdown, and then reverses and trends
8. Delta Tail
A Delta Tail is one of my favorite Delta trade setups. I first wrote about it in 2018. It shows absorption in an individual bar which often has an effect on the next few bars. If you know there is absorption present you can take advantage of what follows, which is often a short term move away from that absorption level.
9. Resting Liquidity
Resting Liquidity is big, strong passive bids and offers in the market that trade which can often act as support or resistance. Being able to identify when Resting Liquidity is trading is very helpful in determining what is taking place in the market. There are different ways to look at Resting Liquidity, does it hold or does it fail? It is from there that you get a clear picture of market direction.
10. Vertical Liquidity
Vertical Liquidity occurs when there is heavier than normal volume being traded on the bid or offer over consecutive levels. Big traders don’t just come in an place their entire order at one price level, they break it up into smaller child orders and layer it into the order book. When it trades out that leaves a footprint on the chart that a big order was here and traded against, which as a trader, once you know identify that big order you can then see how the market reacted to it.
11. Delta Breakout
Delta Breakout occurs when Delta grows either positively or negatively. Delta is the difference between aggressive buyers and aggressive sellers in a bar. When you start to look at Delta not just in the bar itself, but start comparing it to surrounding bars you start to get a clearer picture of how aggressive the aggressive traders really are. Are they trading as per normal or are they getting overly aggressive. When they are overly aggressive, that often can be the start of a big move.
12. Retail Suck
Retail Suck is sign of absorption as traders are being “sucked” in by strong passive traders. We know that the retail trading public is usually on the wrong side of the market. So when you are able to identify when they are active in the market, it can give you great insight of areas to trade. Who do you think is on the other side of their trades? It is often the big institutions or market makers that are the ones who are generally correct.
13. Price Action Divergence
Price Action Divergence occurs when Price and Delta in a bar diverge. Normally when price is going up the bar positive delta and when price is trading lower the bar has negative delta. But what happens when the price is going up but the bar has negative delta? What does that mean? Or when a price goes lower and the bar has positive delta? These are early signs of supply and demand coming into the market. Knowing when this is taking place will give you insight into the supply and demand situation in the market.
Orderflows Trader 7.0 Still Has ALL The Order Flow Analysis Tools From The Previous Version Of Orderflows Trader…
14. Delta/Volume Extreme
This will highlight the Delta/Volume field either CYAN for extreme bullish delta or Magenta for extreme bearish delta. This is a measure of Delta/Volume (bar delta divided by bar volume). Default is 25% which means if the bar’s delta is greater than 25% of the bar’s volume it is a sign of strong aggressiveness. If the Delta field is green or red, it is considered normal trading conditions.
You can adjust the threshold based on the market you are trading. You can also adjust the colors.
15. Delta Extreme
Identify when aggressive buying is at its most strongest, either positive or weak. This is a great sign when a market is about to reverse. When you see extremely strong directional delta come in, it makes for great go with trades.
16. Small Min/Max Delta
When a bar has very little Max Delta that means aggressive buyers never had control of the bar. When a bar has very little or no Min Delta that means sellers never had control of the bar. This information can be helpful in trading because it gives you an idea of which side was more active during that particular bar. Additionally, it can also give you an indication of future market activity. If aggressive buyers were in control during a certain bar, it’s likely that they will continue to be in control in the future.
17. Thin Prints
Thin Prints in a bar is a sign of momentum. What is happening is there is very little counter trade in the two-way auction. Similar to a Market Sweep, the difference being a bar can exhibit several thin prints spread out in a bar, while a Market Sweep is looking for activity over a consecutive range.
18. Buying/Selling Tails
When a buying tail appears, it is a sign of passive sellers disappearing on a push down. As a result of the disappearance of passive sellers on the way down, price often reverses back higher leaving the buying tail present. When a selling tail appears, the opposite happened, a passive buyers disappeared on a push up. The lack of supportive buying on the push up results in price reversing back down leaving the selling tail present. You also have the ability to draw out the zone of the buying tail or selling tail until tested. More on until tested zones a little later. But briefly, I look for long until tested zone to get blown through.
19. Inverse Imbalance 
Until tested zones with Inverse Imbalance. Now you can draw out until tested zones with Inverse Imbalances. When an Inverse Imbalance occurs, it is a sign of trapped traders. Sometimes the levels are never retested in the same day. However, I like to look see these previous areas because they are previous breakout attempts. These are some of the best “go with” trades. Inverse Imbalances occur more in volatile markets, particularly NQ, MNQ, YM, MYM. They do appear in other markets but much less frequently. A sign of trapped traders in a bar. Similar to an Imbalance Reversal but different. A Bullish Inverse Imbalance will print a blue zone on the chart. A Bearish Inverse Imbalance will print a red zone on the chart.
20. Tick Aggregation
This is specific for NQ, MNQ and Crypto traders. For other markets you would not use this feature unless you were looking at a daily chart. What Tick Aggregation does is it lets a user group price levels together to fit on your screen. If you are analyzing cryptocurrency using the free Coinbase feed, you may or may not have realized that many cryptocurrency trades in millionths. In other words, the minimum tick size is $0.000001. Remember, technically you can buy $1.00 worth of BTC. So say you want to buy $1 of BTC when it is trading $40,000 that would be 0.000025 of BTC and would register on the exchange as a trade. The exchange will actually put the data out as a trade at $39,999.999999. If we did not aggregate the ticks, the charts would be impossible to read. Tick Aggregation is also useful in NQ and MNQ which has very big intraday ranges. If you are looking at a 1 minute NQ chart you know that you can’t fit a footprint chart on your screen at times, especially when the market puts in a 50 point range in 1-minute. Now, by aggregating the ticks, by say 4 which is 1 point or 8 which is 2 points, it becomes easier to read.
21. Shorten Big Numbers
Shorten Big Numbers is specific to cryptocurrency. If you have ever looked at a footprint chart of crypto it plots the trades in Satoshi. Most traders don’t realize that and most probably don’t care. But being a perfectionist and a trader, I find it easier to know exactly how many BTC traded or how many DOGE traded or how many ETH traded. It is easier it read a chart and know 9.1 BTC traded as opposed to a large number of 901M.
22. Market Sweep Detector
The Market Sweep Detector shows you areas where a sweep likely occurred. A sweep in the market occurs when a big trader buys or sells through several price levels in one click. For example, the market is 11 bid / 12 offer. A trader has 700 contracts to buy, he knows his buying will move the market and more importantly he knows the market is getting ready to move higher. So he enters his entire size to buy 700 contracts up to 15. He takes out the 12’s, the 13’s, the 14’s and 15’s. If he is not filled, then the balance of his order is working as a 15 bid. A Bullish Market Sweep will be drawn in a zone in dark green color. A Bearish Market Sweep will be drawn in a zone in dark red. These are areas of aggressive market directional trading.
23. Market Weakness Detector
The Market Weakness Detector shows you areas where the market is exhibiting market weakness after a move up which sets the market up for a potential sell off or market weakness after a move down which signals the selling pressure moving the down is weakening and the market is setting up for a potential rally. 
24. Orderflows Sequencing
Orderflows Sequencing occurs when the depth of the market is solidified and the market trades through it. A solidified order book is one which has more volume at each level either on the way up or the way down. Often times the order book has thin spots in it; levels a smaller amount of working orders around it. Please note these are orders that actually trade and get filled. Orders that are entered to give an impression of support or resistance and later pulled as the market gets close have no affect. Orderflows Sequencing is only concerned with orders that trade in the market. A Bullish Orderflows Sequencing will print the sequence in cyan color. A Bearish Orderflows Sequencing will print the sequence in magenta
25. POC Slingshot
The POC Slingshot (The Point of Control Slingshot) is a trade setup based on a bar’s Point of Control in relation to order flow and price action. It signals a potential directional move. A Bullish POC Slingshot will color the POC of the bar green. A Bearish POC Slingshot will color the POC of the bar red. If there is a Slingshot POC and a Prominent POC in the same bar, the Slingshot POC will take precedence over the Prominent POC and color it either green for bullish or red for bearish.
26. Value Area

The Value Area is where 70% of the volume trades in a bar. This is the Value Area for the individual bar. Knowing where the Value Area is on a bar by bar basis understand the order flow better. You can see if traders are accepting or rejecting current value. Individual bar Value Area allows you instantly recognize when volume, and not just price, is migrating higher or lower. When used with traditional forms of technical analysis such as Bollinger Bands or Keltner Channels you will be amazed at how market turning points become much more clear. The Value Area in a bar will be green for up bars and red for down bars. Doji candles are still gray. You can adjust the colors however you want them.

A powerful feature is being able to draw an until tested zone with Value Areas. This is an important feature. Value represents volume. Value Areas that are not traded into in the next bar often present great buying or selling areas. Value Areas are market generated information in its purest sense. Markets are always searching for value, either moving away from value or returning to value. If you ever wondered why a market reverts back to a particular level, it is often due to the market trading back to its previous value. When you add these zones to your chart, market reversals finally make perfect sense.

27. Engulfing Value Area – EVA
The Engulfing Value Area occurs when the current value area engulfs the previous bar’s value area. This is significant because it the result in a significant shift in value. What happens is the current bar trades decent volume out of value, then trades through the entire value area and closes on the other end of value. A Bullish Value Area EVA will print blue on the chart. A Bearish Value Area EVA will print red on the chart.
28. Orderflows Ratios
Orderflows Ratios analyze the order flow in a bar help you determine if there was price rejection in a bar, a Ratio Bounds High. Or, if there was price defense in a bar, a Ratios Bounds Low. The Orderflows Trader software calculates an Orderflows Ratio for each bar and prints it below a green up candle or prints it above a red down candle. When an Orderflows Ratio is bullish or bearish it will print in blue color for bullish ratios and red color with bearish ratios. Bars with normal order flow will print the ratio in regular black color. When the first version of Orderflows Trader was released in 2015, many other order flow software reversed engineered it and added it to their software. The problem was while it was available in their software, without knowing why it is important and how to apply the ratios they are not really useful. As the originator, the trader who trades with these ratios, I teach you how to properly apply them to your order flow analysis.
29. Prominent POC (Point of Control)
Every bar has a Point of Control which is the price level in a bar where the most volume traded. However, when taken in market context, certain Point of Controls signal support or resistance based on market generated information which is one of the reasons why analyzing order flow is so powerful and necessary. A Bullish Prominent Point of Control is printed in cyan color (a light blue color) for the Point of Control for easy identification. A Bearish Prominent Point of Control is printed in magenta color (a light purple color) for the Point of Control for easy identification
30. Orderflows Delta Divergence
A delta divergence occurs when price and delta diverge. When the market makes a new or equal high on negative delta that is a delta divergence. When the market makes a new or equal low on positive delta that is a delta divergence. An Orderflows Delta Divergence takes the delta divergence a step further and uses price action to confirm the delta divergence. A Bullish Orderflows Divergence will color the bottom 2 price levels gold color and the top 2 price levels of the bar gold. You can adjust the colors.
31. Exhaustion Print
Exhaustion prints show when the last buyer has bought in an up move or the last seller has sold in a down move. The buying is exhausted on the move up, there is no more interest is buying and the market will generally naturally drop. Conversely, in a move down, when the selling is exhausted, there is no more selling interest and the market will begin to rise as the buyers clearly outnumber the sellers. A Bullish Exhaustion Print will have a green box drawn on the volume of bar that exhibits and exhaustion print. A Bearish Exhaustion print will have a red box drawn on the volume of the bar that exhibits an exhaustion print. New addition – you can now draw out a zone from the exhaustion print. In the previous version of Orderflows Trader, we referred to this as Small Digit Prints.
32. Imbalance Reversal
An Imbalance Reversal is a sign of trapped traders in a bar. Traders who are long and wrong or short in the hole. A Bullish Imbalance Reversal will color the bottom 2 bid price light green on the chart. A Bearish Imbalance Reversal will color the top 2 offer prices red on the chart. Knowing where traders are trapped give you an edge over the trapped traders who might not know they are even trapped!
33. Zero Prints
A Zero Print is the result of a fast moving close of one bar and opening of another bar with little two trading, mostly one way trading. This is often the result of market sweep or a big order being aggressively traded in the market. A Bullish Zero Print will color the bottom 2 bid prices on a green bar dark green. A Bearish Zero Print will color the top 2 offer prices on a red candle dark red.
34. Volume Profile
You can display the entire day’s Volume Profile, either on the left or right of you chart, or choose not to display it. The Volume Profile has two colors, green and red. The green color indicates the volume traded on the offer – the aggressive buyers. The red color indicators the volume traded on the bid – the aggressive sellers.
35. Stacked Imbalance
A Stacked Imbalance occurs when there are 3 or more imbalances in a bar that are neatly stacked on top of each other. A Bullish Stacked Imbalance occurs when there are 3 or more buying imbalances stacked neatly on top of each other. A Bearish Stacked Imbalance occurs when there are 3 or more selling imbalances stacked neatly on top of each other. A Bullish Stacked Imbalance will print out a green zone on your chart and is a support area. A Bearish Stacked Imbalance will print out a red zone on your chart and is a resistance area.
36. Multiple Imbalance
When there are 3 or more imbalances in a bar in the same direction that are not stacked neatly on top of each other is referred to as a Multiple Imbalance Bar. The difference between a bar with Multiple Imbalance and a bar with a Stacked Imbalance is the imbalances are spread out throughout the bar. Traders often overlook these bars because most traders are only taught to look for Stacked Imbalances. When you see a bar with Multiple Imbalances it shows that traders are directionally aggressive and when you apply the Multiple Imbalances to market context you can pick up shifts in market conditions much earlier than other trader who are not using order flow. Up Bars with Multiple Imbalances have a blue box around the bar. Down Bars with Multiple Imbalance have a red box around the bar.
37. Unfinished Business
Unfinished Business occurs when there is an unfinished auction at the bottom of a down red candle or the top of an up green candle. The market will often “finish” the auction meaning it will trade back to that level, sooner rather than later. Many traders use levels of Unfinished Business as price targets. A Supportive Unfinished Business level will print a red dashed line. A Resistant Unfinished Business level will print a green dashed line.
Orderflows Trader 7.0 for NT8 8Orderflows Trader 7.0 for NT8 9Orderflows Trader 7.0 for NT8 10Orderflows Trader 7.0 for NT8 11Orderflows Trader 7.0 for NT8 12Orderflows Trader 7.0 for NT8 13Orderflows Trader 7.0 for NT8 14Orderflows Trader 7.0 for NT8 15Orderflows Trader 7.0 for NT8 16Orderflows Trader 7.0 for NT8 17Orderflows Trader 7.0 for NT8 18Orderflows Trader 7.0 for NT8 19Orderflows Trader 7.0 for NT8 20Orderflows Trader 7.0 for NT8 21Orderflows Trader 7.0 for NT8 22Orderflows Trader 7.0 for NT8 23Orderflows Trader 7.0 for NT8 24Orderflows Trader 7.0 for NT8 25Orderflows Trader 7.0 for NT8 26Orderflows Trader 7.0 for NT8 27Orderflows Trader 7.0 for NT8 28Orderflows Trader 7.0 for NT8 29Orderflows Trader 7.0 for NT8 30Orderflows Trader 7.0 for NT8 31Orderflows Trader 7.0 for NT8 32Orderflows Trader 7.0 for NT8 33Orderflows Trader 7.0 for NT8 34Orderflows Trader 7.0 for NT8 35Orderflows Trader 7.0 for NT8 36Orderflows Trader 7.0 for NT8 37Orderflows Trader 7.0 for NT8 38Orderflows Trader 7.0 for NT8 39Orderflows Trader 7.0 for NT8 40Orderflows Trader 7.0 for NT8 41Orderflows Trader 7.0 for NT8 42Orderflows Trader 7.0 for NT8 43Orderflows Trader 7.0 for NT8 44


More about product you can see on official site (take a look on beginning of Ad)

ORIGINAL VERSION,THIS IS AN ORIGINAL VERSION

ORIGINAL VERSION,THIS IS AN ORIGINAL VERSION

PREMIUM VERSION NT8

Anything you need, any help with installation, if you have a problem or doubt about your download link, contact us at:

forexoutletshop@gmail.com

Please enter a “CORRECT AND CORRECT EMAIL ADDRESS” when filling out your order, so that the system will send you the download link.

Also check your “SPAM” email, or contact us at:

forexoutletshop@gmail.com


Forex Outlet Shop - Customer Satisfaction GuaranteedForex Outlet Shop - Money Back Guarantee

  • 100% MONEY BACK GUARANTEED (for corrupted or defected files) OR
  • AS A SITE OF TRUST WE GIVE YOU A DOUBLE CHARACTER REPLACEMENT (we give you a 2 “high rated” items if you get (corrupted or defected files)

Forex Outlet Shop - Top rated Plus SellerForex Outlet Shop - Top rated Plus Seller 2Forex Outlet Shop - Top rated Plus Seller 3Forex Outlet Shop - ebay logo

We are “EBAY” school, with a lot of experience in sales. Our priority is customer satisfaction, are you our number one priority.We will always be happy to help you with any technical support in the form of installation of our items and give you advice about Brokers with whom we have contracts and you will always receive special benefits, as well as free advice and Forex Strategies from us.

As a trusted Forex Site, your satisfaction is our number one priority and we will strive to meet you in a way that will always “exceed” your expectations.

As a long-time “EBAY” Top Rated Seller Plus, we have decided to develop and expand our business through this site. You have all the benefits and three times more benefits with us …. see you here and “Stay Safe” in these difficult times!

Some items you will receive “instantly”,but some items you will receive for max.24h (usually few hours),because we have a several servers,and some of them need manual sending because we have an extremely large warehouse of items
After purchase,if you don’t receive your download link,you will get it for max.24h (usually few hours)-from 20min to 2 hours,also you will get one popular Item as a gift from us
In the case when you purchase item,and you “get” “instantly”,you will also get one popular Item as a gift from us max.24h (usually few hours)-from 20min to 2 hours
We send you your items to the email address you provided when paying, and please “MUST” check that our message with your Item did not come to “SPAM” instead of “inbox”, is this a common case
If you do not receive a message from us with your item, please notify us immediately by email and we will respond immediately and send you your items and gift by sending through “reply”from the received email

Features Product details
Compatible with NFA, FIFO and NT8 Platform: NT8
ECN Support Language: English
Perfected For Multiple Pairs Time Frames: System works with every NT8 TF
Works With Any NT8 Trading Brokerage Trading Time: Any time | Recommended London and New York sessions
Unlimited Licenses For All Your NT8 Accounts Currency pairs: Any pairs | Recommended major pairs + indexes
No Trading Experience Required Purchase includes: Indicators | Templates
US Brokers | Non-US Brokers Trading Accounts: Unlimited
No Trading Account Limitations License: Unlimited
Popup Alerts Indicators (Unlimited)
No Minimum Leverage Required
* instant delivery (email inbox/account dashboard)

Conclusion:

I want to repeat that the system is very effective. It will definitely help you achieve your financial goals whatever they are.

Fast delivery within 24 hours

I’m reseller of unlocking digital good’s

I’m not a trader

All indicator’s,FX strategies and EA’s are working and unlocked for use

Please note: I do not give refunds based on the performance of the product. There are many factors that can affect the performance and results of the product such as brokers, internet connection and the experience of the user. You are receiving a working product that has been tested and all sales are final.

no returns accepted for any reason

Forex Outlet Shop
Logo
Shopping cart