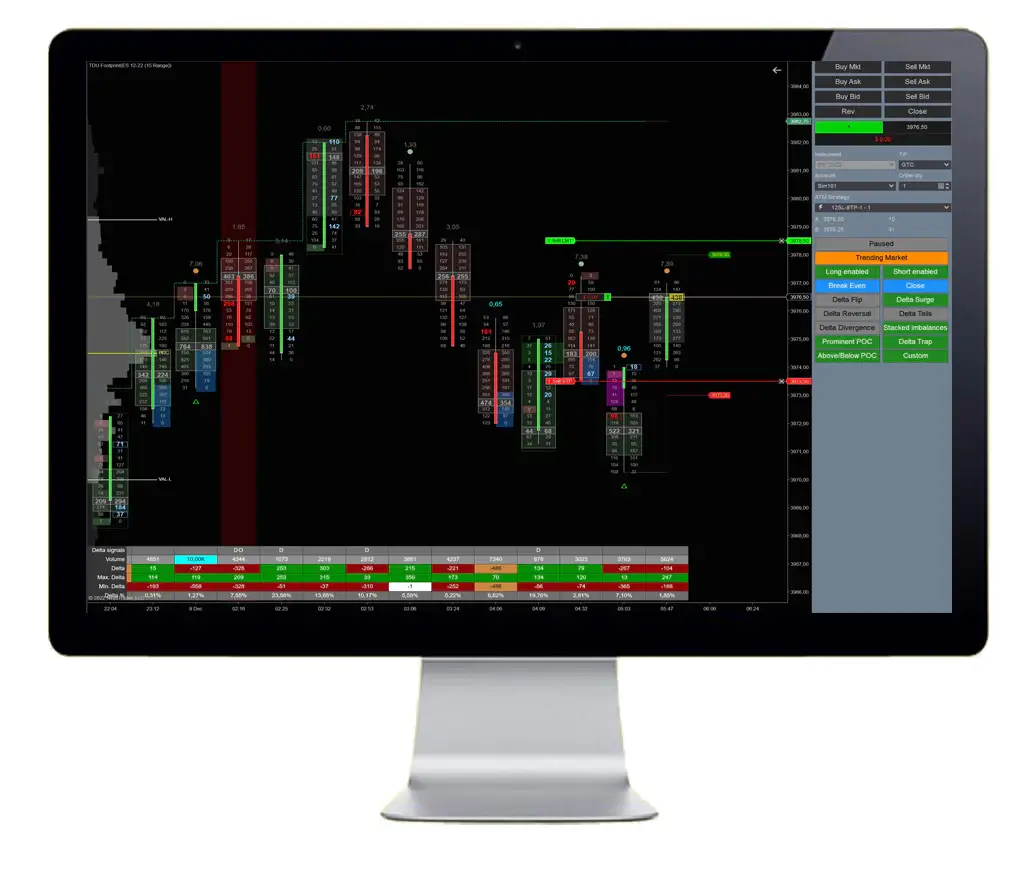


TDU Auto Orderflow Footprint Trader NT8
TDU Auto Orderflow Footprint Trader NT8-Our orderflow foorprint indicator allows you to auto-trade the best footprint signals available
Original price was: 775,00 $.39,95 $Current price is: 39,95 $.
Full Item description:
Description:
Content: 17 dll
Original Website: https://tradedevils-indicators.com/products/orderflow-footprint-trader?_pos=2&_sid=e242c85c7&_ss=r
Original Price: $ 775
Product Description:
Please note:
– The Auto orderflow footprint trader does NOT include a Footprint chart indicator It will work with any footprint chart (including NinjaTraders) So if you already own a footprint indicator you can just use it. However not every 3rd party footprint indicator might be able to show all the signals. We do recommend to use it with our own footprint indicator
– This is an automated strategy. You will find it under strategies (NOT under indicators)
– You need to enable an automated strategy first for it to work
Key Features
Our orderflow foorprint indicator allows you to auto-trade the best footprint signals available
Auto trade 15 orderflow strategies
Stacked imbalance, Delta flip, Delta divergence, Delta Surge/Drop, Delta Tail, Delta trap, continuous POC and custom
Advanced order panel
Allows you to pause / run the strategy, quickly turn strategies on/off , disable longs/shorts and many more
Volume and delta filters
Stacked imbalance, Delta flip, Delta divergence, Delta Surge/Drop, Delta Tail, Delta trap, continuous POC and custom
Auto position sizing
Fixed % of contracts, fixed amount / trade or risk certain % of your account
Advanced stop placement, trailing stops and breakeven
Stacked imbalance, Delta flip, Delta divergence, Delta Surge/Drop, Delta Tail, Delta trap, continuous POC and custom
Day & Time filters
Only allow the strategy to trade at specific date & times
Daily loss & profit & drawdown filters
Stacked imbalance, Delta flip, Delta divergence, Delta Surge/Drop, Delta Tail, Delta trap, continuous POC and custom
Define your own custom signals
Define your own custom entries using c# scripting

Auto trade 15 different orderflow strategies
below you will find the stratgies which can be traded. Note your can turn any strategy on/off at any time you like without the need to stop the auto trader. You can combine multiple strategies, set volume and delta filters and even create your own custom strategy

Above / Below POC Strategy
The Above/below POC strategy will open a trade whenever a bar opens & closes above or below the POC. When both the open and the close are above the POC this is a clear indication that buyers and sellers stepped into the market and price will continue at least a little bit further. On the left you can see an example of a red bar opening and closing below the red value area. The indicator opens a trade the moment the bar closes and quickly reaches profit
Rules:
LONG:
-A green bar that opens & closes above the POC at a swing low
SHORT:
– a red bar that opens & closes below the POC at a swing hi

Delta Divergence Strategy
The delta divergence is a trend reversal signal.
RULES:
LONG:
– Price makes a new low with a green candle and positive delta
SHORT:
– Price makes a new high with a red candle and negative delta
EXAMPLE
On the right we can see a red bar making a new high, but with -160 delta being formed. When the red bar closes the auto trader will immediately open a short trade which hits its target a few seconds later

Delta Tail Strategy
A delta tail signal occurs when a bar has a negative delta at all price levels except the bottom of the bar and vice versa.
RULES
LONG
– green bar with postive delta at all prices except the bottom
SJORT:
– Red bar with negative delta at all price levels except the top
EXAMPLE
On the left you see a bar that has a negative delta at all price levels except at the top.

Delta Reversal Strategy
The Delta Reversal strategy opens a trade when a bar has an above-average max and min delta.
RULES
LONG:
– green with above-average max and min delta
SHORT:
– red bar with above average max and min delta
EXAMPLE
On the right we see that the second bar has a high max and high min delta, and prices reverse.

Delta Surge/Drop Strategy
The delta drop strategy uses a a 4-bar signal The signal happens when there is a sudden decrease in the delta and when the delta is getting weaker and weaker . or when there is an increase in delta and delta is getting stronger and stronger
RULES:
LONG
– 4 consecutive bars with increasing delta
SHORT:
-4 consecutive bars with decreasing delta
EXAMPLE:
On the left you can see that price made a new low which got quickly rejected. The first green bar gave a delta surge signal because the last 4 bars each had increasing delta and the strategy went long exactly a the bar close resulting in a winner

- 100% MONEY BACK GUARANTEED (for corrupted or defected files) OR
- AS A SITE OF TRUST WE GIVE YOU A DOUBLE CHARACTER REPLACEMENT (we give you a 2 “high rated” items if you get (corrupted or defected files)


![]()
We are “EBAY” school, with a lot of experience in sales. Our priority is customer satisfaction, are you our number one priority.We will always be happy to help you with any technical support in the form of installation of our items and give you advice about Brokers with whom we have contracts and you will always receive special benefits, as well as free advice and Forex Strategies from us.
As a trusted Forex Site, your satisfaction is our number one priority and we will strive to meet you in a way that will always “exceed” your expectations.
As a long-time “EBAY” Top Rated Seller Plus, we have decided to develop and expand our business through this site. You have all the benefits and three times more benefits with us …. see you here and “Stay Safe” in these difficult times!
Some items you will receive “instantly”,but some items you will receive for max.24h (usually few hours),because we have a several servers,and some of them need manual sending because we have an extremely large warehouse of items
After purchase,if you don’t receive your download link,you will get it for max.24h (usually few hours)-from 20min to 2 hours,also you will get one popular Item as a gift from us
In the case when you purchase item,and you “get” “instantly”,you will also get one popular Item as a gift from us max.24h (usually few hours)-from 20min to 2 hours
We send you your items to the email address you provided when paying, and please “MUST” check that our message with your Item did not come to “SPAM” instead of “inbox”, is this a common case
If you do not receive a message from us with your item, please notify us immediately by email and we will respond immediately and send you your items and gift by sending through “reply”from the received email
| FEATURES | PRODUCT DETAILS | |
|---|---|---|
| Compatible with NFA, FIFO and NT8 | Platform: NT8 | |
| ECN Support | Language: English | |
| Perfected For Multiple Pairs | Time Frames: System works with every NT8 TF | |
| Works With Any NT8 Trading Brokerage | Trading Time: Any time | Recommended London and New York sessions | |
| Unlimited Licenses For All Your NT8 Accounts | Currency pairs: Any pairs | Recommended major pairs + indexes | |
| No Trading Experience Required | Purchase includes: Indicators | Templates | |
| US Brokers | Non-US Brokers | Trading Accounts: Unlimited | |
| No Trading Account Limitations | License: Unlimited | |
| Popup Alerts | Indicators (Unlimited) | |
| No Minimum Leverage Required | ||
| * instant delivery (email inbox/account dashboard) | ||
| Features | Product details | |
|---|---|---|
| Compatible with NFA, FIFO and NT8 | Platform: NT8 | |
| ECN Support | Language: English | |
| Perfected For Multiple Pairs | Time Frames: System works with every NT8 TF | |
| Works With Any NT8 Trading Brokerage | Trading Time: Any time | Recommended London and New York sessions | |
| Unlimited Licenses For All Your NT8 Accounts | Currency pairs: Any pairs | Recommended major pairs + indexes | |
| No Trading Experience Required | Purchase includes: Indicators | Templates | |
| US Brokers | Non-US Brokers | Trading Accounts: Unlimited | |
| No Trading Account Limitations | License: Unlimited | |
| Popup Alerts | Indicators (Unlimited) | |
| No Minimum Leverage Required | ||
| * Due to reviews of themegareview.co.uk | ||
Delivery: Instant delivery (email inbox/account dashboard)
Conclusion:
I want to repeat that the system is very effective. It will definitely help you achieve your financial goals whatever they are.
Package include: System Indicators and template in a zip folder
Fast delivery within 24 hours
I’m reseller of unlocking digital good’s
I’m not a trader
All indicator’s,FX strategies and EA’s are working and unlocked for use
Please note: I do not give refunds based on the performance of the product. There are many factors that can affect the performance and results of the product such as brokers, internet connection and the experience of the user. You are receiving a working product that has been tested and all sales are final.
no returns accepted for any reason
Related Products
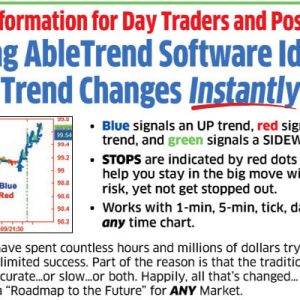
ABLESYS AbleTrend Add-on for NT8
Forex DJ MARKET X20 (Indicators + EA)

Ninjacators(18 indicators+BONUSES) for NT8

MQ Momentum Trender Pro 2 for NT8 & TOS
Zeus Arrow Smart Order Block v3

Delta Flip Strategy
The Delta flip signal is a 2-bar signal. It triggers when there is a sudden shift in Delta from positive <-> negative and indicates a potential reversal.
RULES
LONG:
-The first bar closes on its min-delta and has a max-delta around 0.
-The next bar closes on its max-delta and has a min-delta around 0
SHORT:
– the first bar closes on its max-delta and has a min-delta around 0.
-The next bar closes on its min-delta and has a max-delta around 0
Up to 5 User defined custom strategies
The custom strategy is a strategy you can define yourself. You can use C# to code your own strategy and take longs/shorts on the rules you decide. Scroll down to the customs signals section for more information
You can define a total of 5 different custom strategies and you can assign a button label to each one of them
Stacked imbalances Strategy
Stacked imbalances occur when we have 3 (or more), imbalances stacked on top of each other.
When a stacked imbalance is detected the strategy will take a long/short
Rules
LONG
– 3 or more imbalances on the Ask
SHORT:
– 3 or more imbalances on the Bids
You can change the number for the stacked imbalances. Default is 3
In the example on the right we see a sell imbalance being formed and as soon as the candle closes the autotrader opens a trade
Continuous POC strategy
When 2 or more bars have their POC at the same price level we call this a continuous POC. Its a indication of a strong level and thats what forms the base of this strategy
RULES:
LONG:
– a continuous POC (2 bars with same POC)
– followed by a bar with a high positive delta and/or a value area gap up
SHORT:
– a continuous POC (2 bars with the same POC)
– followed by a bar with a high negative delta and/or a value area gap down
Delta trap strategy
The delta trap strategy is a 3-bar strategy which looks a delta reversing and followed with stremgth
RULES:
LONG:
– bar 1 : big negative delta
– bar 2: big positive delta
– bar 3: ema 5 is up
– bar 3: big positive delta and/ and/or a value area gap up
SHORT:
– bar 1 : big positive delta
– bar 2: big negativedelta –
– bar 3: ema 5 is down
– bar 3: big negative delta and/ and/or a value area gap down
On the right we can see an example. First bar had -813 delta, next bar had +1536 delta and 3rd bar had a value area gap up AND high positive delta.. The auto trader would go long after the 3rd bar
Exhaustion prints
Exhaustion prints indicate weakness. In an up trend we would like to see a good amount of contracts traded at the high, while in a downtrend we would like to see a good amount of contracts traded at the low. If this is not the case and we see only a small amount of volume at the high in an uptrend, or at the low in a downtrend then this indicates weakness or exhaustion. The trend might come to an end or go into a consilidation area
RULES:
Short:
– red candle with (almost) no volume at the ask at the high of the bar
Long:
– green candle with (almost) no volume at the bid at the low of the bar
Volume Sequencing
Volume sequencing occurs when we have multiple price levels with increasing volume. when we see this we know the big guys are buying this market up (or selling it down) with force
Bullish volume sequencing is colored On the right we see a footprint chart in which 3 bars contain volume sequencing.
A clear indication the trend is up If we take at the first bar then we can see buyers pushed the market up from the low and bought it up with increasing volume (0, 17, 165, 181 ,573).
Each price level has an increasing volume volume sequencing can also be extended tot the right for a fixed number or bars, until broken , or until tested
RULES:
Short:
– bearish volume sequencing
Long:
– bullish volum sequencing
Bullish/Bearish POC
Each bar has a POC (Point of control) which is the price level where most volume in that bar was traded.
When markets are in a normal state we expect the POC to be in the middle of the bar. In up trending markets we expect them to be in the upper 3rd of the bar and in a bearish trend we want to see them in the bottom 3rd of the bar
An extreme POC is an POC which happens at the extreme top or bottom of the bar. Its a good reversal signal which indicate that aggresive buyers/sellers stepped in and prevented the price from going lower ( or higher)
RULES:
– LONG
Green bar with POC in the lowest 3 price levels of the bar
– SHORT
Red bar with POC in the upper 3 price levels of the bar
Value Area Gap
A value area gap occurs when there is a gap between the value area’s of 2 consective bars.
On the right you see 2 green bars. The gap between the two value areas is market by the arrows
RULES:
– LONG
Green bar with value area gap up
– SHORT
Red bar with value area gap down
Delta sweep signal
A delta sweep signal occurs when a aggresive buyer (or seller) steps in and starts buying all the asks (or selling the bids) , sweeping multiple price levels without any counter trading. When this happens in conjunction with strong delta we have a delta sweep. This is a trend continuation signal
RULES:
– LONG
Green bar with strong positive delta and a market sweep , sweeping multiple price levels to the up side
– SHORT
Red bar with strong negative delta and a market sweep , sweeping multiple levels to the downside
Trapped Traders
The concept of “trapped traders” refers to those market participants who find themselves in unfavorable positions due to incorrect predictions about market movements. For instance, consider the situation on the right where a significant amount of selling activity occurs at the lowest point of a price bar, but subsequently, the bar closes green. In this case, the traders who sold at the lowest point are considered “trapped” in a short position, as the market is moving against their expectations.
To mitigate their losses, these trapped traders will need to close their short positions by placing buy orders.
This influx of buy orders can contribute to the existing upward momentum in the market, further intensifying the price increase. In summary, trapped traders are market participants who, due to their incorrect predictions, inadvertently contribute to the continuation of a price trend in the opposite direction of their initial positions.
RULES:
– LONG
Green bar with most volume traded in the bottom of the bar
– SHORT
Red bar with most volume traded in the top of the bar
Delta slingshot
Indicates a possible trend reversal when selling volume gets overrun by buying volume and market closing higher
RULES:
For shorts
– a red bar with extreme negative delta
– followed by a green bar which closes above the red bar with positive extreme delta
For longs:
– a green bar with extreme positive delta
– followed by a red bar which closes below the green bar with negative extreme delta EXAMPLE:
In the example we see a red bar with -1321 delta Then after a consilidation bar the next bar closes above the red bar with with +1669 delt
Order management
The footprint auto trader is an automated strategy which allows you to auto-trade up to 8 different footprint signals.
Trade scalps + runners
The auto trader can trade a scalp and optionally a runner as well. You can define your target, trailing stop, stoploss for both of them.
The scalp can quickly reduces your risk to 0 while the runner tries to get you the most out of these big moves we all love
………..AND MANY MORE
YOU CAN FIND IT ON THE ORIGINAL WEBSITE ABOVE
Create your own custom entry signals
One of the unique features of this strategy is that you can use C# script to create your own custom entry signals.
With these c# scripts you can create advanced signals based on any of the bars and all their metrics.
NOTE THAT YOU CANNOT USE OTHER INDICATORS, STRATEGIES AND/OR ACCESS NINJATRADER API’S INSIDE YOUR CUSTOM SIGNALS
Volume – the total bar volume value
Delta – the bar delta value
MinDelta – the bar min delta value
MaxDelta – the bar max delta value
DeltaRate – the delta rate
DeltaChange – the change in delta between this bar and the previous bar
VolumePerSecond – The volume traded / second
Duration – The bar duration(as a c# timespan)
DeltaVolume – the delta in volume between this bar and the previous bar
DeltaVolumePercentage– the delta volume % between this bar and the previous bar
MinDeltaVolume– the max delta volume between this bar and the previous bar
MaxDeltaVolume– the min delta volume between this bar and the previous bar
DeltaPercentage – the bar delta / volume% value
COTHigh – the bar COT High value
COTLow – the bar COT Low value
Open – the bar’s open price
Close – the bar’s close price
High – the bar high price
Low – the bar low price
CumulativeDelta – the cumulative delta value for the bar
CumulativeVolume – the cumulative volume for the bar
POC – the bar POC price
ValueAreaHigh – the bar Value Area High price
ValueAreaLow – the bar Value Area Low price
TotalAsks – the bar total ask volume
TotalBids – the bar total bid volume
Trades – the number of trades executed in the bar
IsGreenBar – true if the bar is a green candle, false otherwise
IsRedBar – true if the bar is a red candle, false otherwise
Ratio – bar ratio
OpenAndCloseAbovePOC – (bool) bar opens and closes above its POC
OpenAndCloseBelowPOC – (bool) bar opens and closes below its POC
DeltaRise – (bool) Bar has a delta rise signal
DeltaFlip – (bool) Bar has a delta flip signal
DeltaTail – (bool) Bar has a delta tail signal
DeltaReversal – (bool) Bar has a delta reversal signal
DeltaDrop – (bool) Bar has a delta drop signal
DeltaSweep – (bool) Bar has a delta sweep signal
CloseAtMinMaxDelta – (bool) Bar closes around its min/max delta
BuyImbalances – List<double> – List of all prices (inside the bar) which have buy imbalances
SellImbalances – List<double> – List of all prices (inside the bar) which have sell imbalances
StackedBuyImbalances – List<double> – List of all prices (inside the bar) which have stacked buy imbalances
StackedSellImbalances– List<double> – List of all prices (inside the bar) which have stacked sell imbalances
OverSizedBuyImbalances– List<double> – List of all prices (inside the bar) which have oversized buy imbalances
OverSizedSellImbalances– List<double> – List of all prices (inside the bar) which have oversized sell imbalances
BigBuyImbalances– List<double> – List of all prices (inside the bar) which have bigbuy imbalances
BigSellImbalances– List<double> – List of all prices (inside the bar) which have big sell imbalances
Below is an sample strategy which shows how to go long / short depending on the previous bar volume, delta and candle color